 Nabhya
Crop health monitoring
Crop health monitoring, flight after flight.
Monitoring is only useful when it is consistent. Nabhya returns the same panels and the same figures for every flight, so change across the season is visible rather than remembered.
Every run returns
- Vegetation stress map
- Per-pixel vigour, aligned to the frame
- Management zones
- Worst 10% · middle · best 10%
- Canopy cover
- Share of frame counted as crop
- Health summary
- Vigour mean and range for the analysed area
- Confidence
- Level plus the reasons behind it
- Pixel accounting
- Analysed share and excluded share
Consistency
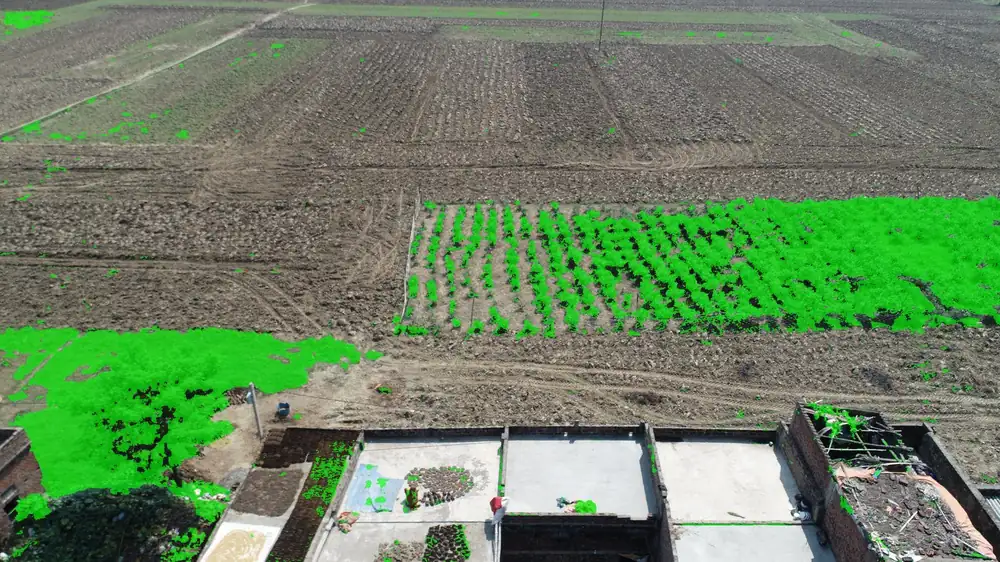 canopy mask
Because non-crop pixels are removed before any statistic is computed, a village in the corner or a track through the middle does not move the field average between visits.
Values are relative within each image, so compare zone patterns across flights rather than raw index numbers. Supplying a field boundary keeps neighbouring plots out and raises confidence.
Run it at scale
Batch a full flight in one sitting, or call the API per frame from the pipeline you already run. CPU inference means no GPU fleet to budget for.
Get a result
Send us one frame.
If you have a recent RGB flight sitting on a drive, send a single frame and we'll return the full result for it — free, no account. It's the fastest way to find out whether this is useful to you.
- Returned
- Vigour map, zones, canopy mask, summary
- Turnaround
- Same day, seconds of compute
- Cost
- Free during onboarding