 Nabhya
Vegetation stress
Vegetation stress detection from RGB drone photos.
Healthy and failing plants sit within a few shades of green. By the time the difference is obvious in a photograph, the loss is already in the ground. Nabhya separates them from the same image.
Where to walk first
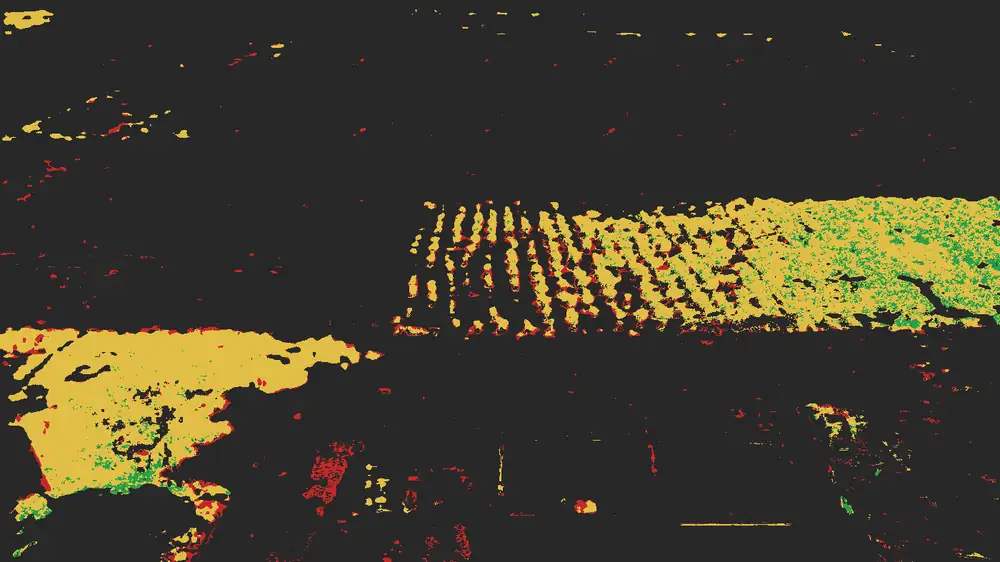 ranked zones
Stress is returned as a ranking, not a diagnosis. The weakest zones are called out first, so a single agronomist covering forty fields has a defensible visit order before anyone gets in the vehicle.
Rooftops, tracks, water and bright bare soil are excluded before any average is taken, and the excluded share is reported on every run.
Messy frames
Fragmented plots, tracks cutting through, half the frame bare after tillage. Nabhya handles the mess and tells you how much of it it had to leave out — then ranks what remains.
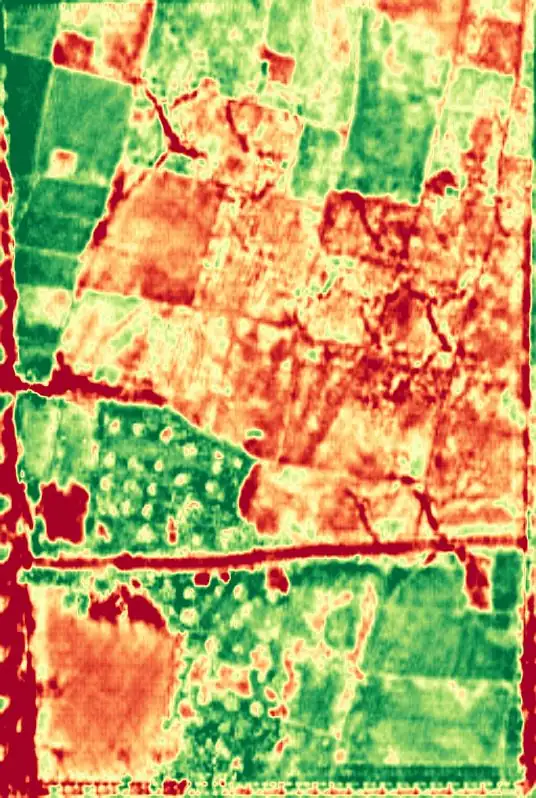 stress map
What it will not do
Nabhya screens; it does not diagnose. There is no pest identification, no yield forecast and no soil nutrient read. The map tells you where to walk — the diagnosis stays with the agronomist standing in the field.
Get a result
Send us one frame.
If you have a recent RGB flight sitting on a drive, send a single frame and we'll return the full result for it — free, no account. It's the fastest way to find out whether this is useful to you.
- Returned
- Vigour map, zones, canopy mask, summary
- Turnaround
- Same day, seconds of compute
- Cost
- Free during onboarding